

Passer rating is determined by four statistical components, each of which is computed as a number between zero and 2.375. The benchmarks for these statistics are based on historical averages. If any of the raw components are beyond the limits of zero or 2.375, the component is set to limiting value of zero or 2.375 as the case may be.
- The component for completion percentage, C, is calculated as:

- The component for yards per attempt, Y, is calculated as:

- The component for touchdowns per attempt, T, is calculated as:

- The component for interceptions per attempt, I, is calculated as:

The four components are then added, divided by 6, and multiplied by 100. Thus, the formula for passer rating can be given as:

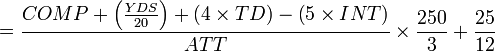
Confused yet? If so, Wikipedia has an alternative formula, which appears even more complex:
The sum C + Y + T + I can be rewritten as:


Multiplying this by 100/6 gives a final rating of:
I think it's fair to say that you need an Excel spreadsheet to calculate this stat. And passer rating is certainly not something that you can sometimes calculate in your head (as opposed to a hitter's BA or OBP, or a pitcher's ERA or K/BB ratio).
I also wonder why NFL analysts, among others, still rely on this stat. It's not like a passer rating even means anything to 99% of football fans. The scale is just so arbitrary! We like round numbers, so it's hard to accept that from 2000 - 2003, the average NFL passer rating was 78.9. Therefore, a passer rating of 68 would not be awful, despite how low the number looks. It would just be slightly below average. On the other hand, a QB rating of 108 - a number very far from the max of 158.3 - would be outstanding.
It's just a confusing system. Did you know that a QB has a minimum passer rating of 39.6 just by virtue of not throwing an interception? JaMarcus Russell could go 1-1 for 2 yards and no picks and leave with a passer rating of over 40. Yet you can throw for 2 TDs and leave with a lower passer rating if you throw a couple of picks, too. Weird.
Here are the stats that provoked this post.
Eli's first-half stats at Oakland in Week Five: 8-for-10, 173 yards, 2 TD, 0 INT, perfect QB rating 158.3
Tom Brady's stats vs. Tennessee in Week Six: 29-for-34, 380 yards, 6 TD, 0 INT, QB rating 152.8
Now, which QB's performance would you rather have for your team? Exactly. Why people continue to rely on this stat, broadcast this stat, use this stat to compare QBs....I have no idea. It's cumbersome to calculate, difficult to understand, and flat-out misleading. If you want to compare passers, how about using easy stats...just more of them. An assortment of completion percentage, TD/INT ratio, and YPA (yards per attempt) is a much clearer way to distinguish good passers from bad ones.


No comments:
Post a Comment